 For years, big companies have been harnessing the power of business intelligence (BI) to improve business performance. And for them, paying experts to analyze large data sets is no issue. It’s different with small- and medium-sized businesses (SMBs). SMBs also store large volumes of data, but many are wary of spending too much on BI. […]
The post Why small businesses should consider business intelligence appeared first on Complete Technology Resources, Inc..
For years, big companies have been harnessing the power of business intelligence (BI) to improve business performance. And for them, paying experts to analyze large data sets is no issue. It’s different with small- and medium-sized businesses (SMBs). SMBs also store large volumes of data, but many are wary of spending too much on BI. […]For years, big companies have been harnessing the power of business intelligence (BI) to improve business performance. And for them, paying experts to analyze large data sets is no issue. It’s different with small- and medium-sized businesses (SMBs). SMBs also store large volumes of data, but many are wary of spending too much on BI. Still, SMBs should leverage BI to gain an edge — fortunately, there’s plenty of budget-friendly business tools and resources available nowadays.
Self-service BI tools are plentiful — and inexpensive
The emergence of self-service BI puts useful business analytics within reach of smaller-business owners who lack the big budgets of larger corporations. In fact, there are numerous self-service BI tools that you can use to get started in this area without even spending a dime. Microsoft Power BI is a powerful and user-friendly application, and most businesses will find the functions they need in the free version. Zoho Analytics has a low entry-level cost, too, and the slightly pricier yet still affordable Tableau is another option worth exploring.
You’ve already got the data you need
It’s easy to underestimate the amount of data your SMB already has at its disposal. In every area of your business, from finance and sales to customer relations and website management, the software packages you use to simplify your everyday operations reap tons of information that most of us don’t even think twice about.
By talking to key stakeholders in your organization’s various departments, you can get an idea of the kind of data you already have, how it’s generated, and where it’s stored. You can then utilize BI tools to transform that information into meaningful business insights that will inform your decision-making. No need for you to invest in time-consuming data generation from scratch!
It’s easy to get started
BI is an intimidating term, especially for the average business owner. But by taking small steps, it’s easy for anyone to get started. Before you know it, you’ll be enjoying the benefits of having data-driven, intelligence-based insights that will enable you to make better business decisions.
Most self-service BI tools come with built-in suggestions for reports that businesses commonly run and find useful. Some worthwhile statistics to explore include the percentage of your clients who cancel within a given period, website landing pages that generate the longest visits, your most profitable individual products or services, the days or months in which you generate your highest revenues, and which of your clients bring in the most revenue and profit.
Harnessing data is the future of the business world — it’s how companies like yours can make smarter decisions that increase efficiency and profitability. And with a trove of self-service tools available in the market, SMBs no longer need a humongous budget to reap the benefits of BI. To find out more about implementing tools that can help you do smarter business, just give us a call.
The post Why small businesses should consider business intelligence appeared first on Complete Technology Resources, Inc..
 Business intelligence (BI) has fueled the growth of many businesses through the years, especially in the finance and manufacturing industries. Today, the benefits extend beyond those industries, as BI and big data have become important tools for healthcare businesses aiming to improve their processes. At its core, BI software is all about data analytics. BI […]
 Business Intelligence (BI) has conventionally been limited to big business; only they can afford pricey experts with specialist knowledge who can leverage BI’s value. But the rise of self-service BI tools has leveled the playing field, allowing small- and medium-sized businesses (SMBs) to get in on the game too. And with SMBs now producing far […]
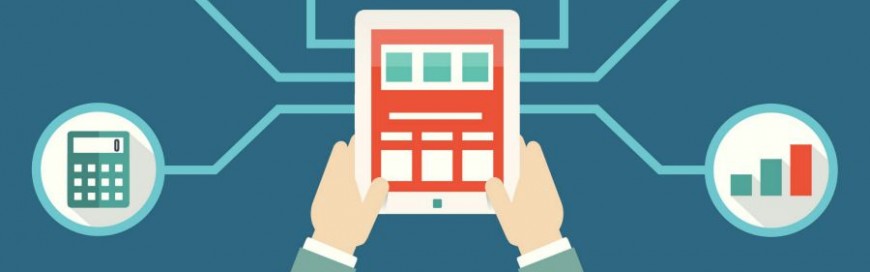 Dashboards have become extremely useful tools for companies to make the most of their raw data. With proper implementation, a dashboard can display essential information in an easy-to-understand format, allowing business owners to easily make informed decisions. But a dashboard can say a lot of things depending on its setup, and it’s important to choose […]